The Surprising Truth About Ad A/B Testing: Why Small CTR Differences Might Be Misleading
Identical ads can show wildly different click-through rates (CTR) because of factors outside the ad itself
Hey there, fellow marketers and data enthusiasts! If you’ve ever run an A/B test on your ads, you know the thrill of seeing one variant outperform the other. But what if I told you that even identical ads can show wildly different click-through rates (CTR) just because of factors outside the ad itself? That’s exactly what happened in a recent experiment I conducted, and it completely changed how I approach ad testing. In this post, I’ll walk you through the setup, the results, and the big lesson I learned. Buckle up—it’s a reminder that data isn’t always as straightforward as it seems.
Setting Up the A/B Test: Keeping It Simple (Or So I Thought)
The goal was straightforward: I wanted to test two different landing pages for a product campaign. To isolate the variable, I created two identical ads. Same headline, same copy, same image, same call-to-action—literally pixel-for-pixel the same. The only difference? Each ad directed traffic to a unique landing page.
Ad A linked to Landing Page 1: Home page that was optimized for conversions.
Ad B linked to Landing Page 2: An old landing page focused on the keyword.
I ran these ads on the same platform (Google Ads), targeting the same audience. In theory, since the ads were clones, their CTR should have been nearly identical, right? After all, CTR is calculated as (Clicks / Impressions) × 100, and the ad creative is what primarily drives clicks. Spoiler: Theory didn’t match reality.
The Shocking Results: Identical Ads, Wildly Different CTR
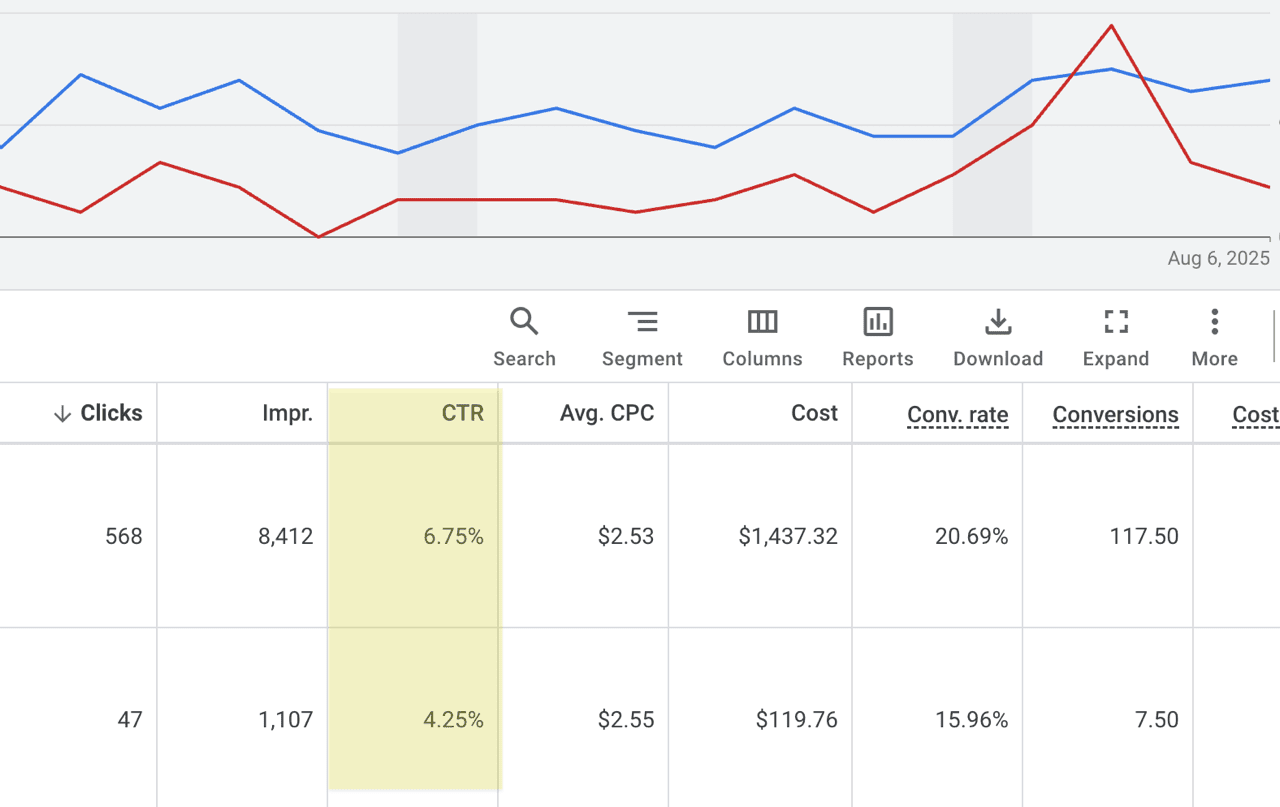
When the data rolled in, I was floored. Here’s a quick breakdown of the key metrics:
Metric
Ad A (Landing Page 1)
Ad B (Landing Page 2)
CTR
6.75%
4.25%
Ad A crushed it with a 6.75% CTR, while Ad B lagged at 4.25%—a 59% relative difference! Remember, these were the exact same ads. No tweaks to the creative, no changes in targeting.
What This Means for Ad Testing: The Need for Statistical Significance
This experiment was an eye-opener. In traditional A/B testing, we often declare a “winner” based on a small CTR lift—say, 0.5% to 1%. But if identical ads can vary by 2.5 full percentage points due to external variables, how can we trust those tiny differences? The key takeaway? Demand a very significant difference in CTR before gaining confidence in your results. Here’s why and how:
Account for Noise and Variability: Ads don’t exist in a vacuum. Factors like landing page speed, device type, time of day, or even ad platform algorithms can introduce “noise” that skews results.
Use Statistical Tools for Confidence: Don’t eyeball it—run a statistical significance test. In this case I had a 95% confidence level but this was clearly not enough.
Run Longer and Iterate: Short tests amplify anomalies. We all like to come to conclusions as soon as possible in order to optimize results for our clients. But 95% confidence level may not be enough.
Wrapping It Up: Test Smarter, Not Harder
My identical-ad experiment was a humbling reminder that marketing data is messy. From now on, I’m setting a higher bar for CTR differences in my tests, and I encourage you to do the same. Otherwise you may run the wrong ad.